Sorry I don't regularly blog. I do have a lot of interests and work does have a tendency to get in the way. A lot of my interests revolve around radio. To me the fact that you can transmit information in various methods using EM Radiation of any type is still remarkable to me. To that regard, I'm thinking about putting together a post on how this even works down to the quantum level.
Anyway, the purpose for this post. I'm always interested in how signals propagate. This will apply to a standard radio, but also a crystal radio. There is a nice website that will show you the estimated signal strength at your location. This particular antenna is about 2km from my house and pretty much blasts everything with radiation. https://radio-locator.com/cgi-bin/finder?sr=Y&s=C&call=WLNA&nav=home
The site shows the transmitted power, the antenna pattern and will show you the estimated field strength at your location.
Ham radio operators can get field strength meters. These are pretty simple and clunky and intended to see how well your antenna responds. By and large, they are focused on relative strength. This got me to thinking, can I actually measure absolute field strength? Without a calibrated device this doesn't really translate well. The problems I've thought of are:
- I need to understand the range and bearing from my antenna to the source antenna
- need to estimate the gain from the source antenna pattern based on my range and bearing
- my antenna is far from idea and has a specific orientation. how do I back that out?
- Nothing is really calibrated? How can I figure out an overall gain factor for the system.
With all of that in mind, what I did was hook up a long wire antenna through a ad-hoc transformer to a digitizing oscilloscope with the input impedance at 1Mohm. A very simple way of thinking about this is:
The scope is a Tektronix DSA602 and I wrote an interface to it using GPIB. (old, but hey all my equipment is literally picked from a junk pile.)
Much time later after getting compulsive about the programming (source can be found here:
https://github.com/clirakis/Scope Some of the programs I write use cern root:
https://root.cern/ which is a great package, but is kinda steep in the learning curve. I'd be happy to port it to python using marplotlib if anyone ever asks.)

Ok, so that's kind of cool. The signal on WLNA is awfully low considering it's only 2km away and something like WFAN is 30+ km away. BTW, I also did some modeling in a Juypter notebook and the code can be found here:
https://github.com/clirakis/Jupyter/tree/main/HamRadio look for AMFieldStrength notebook. In the notebook I use proj to calculate the distance between my location and the antenna location as well as take into account the pattern. I get a 1.5dB difference between the FCC map prediction and what I would predict. This is not reflected in the plot above, where there is about a 45dB difference. I used a different database here for the Field Strength predictions.
Use the AM radio station in Peekskill, New York.
https://en.wikipedia.org/wiki/WLNA
Antenna Coordinates: 41°18′31.13″N 73°54′59.0868″W, 1.9kM from house
https://www.fcc.gov/media/radio/figure8
https://www.fcc.gov/media/radio/am-query
F = 1420KHz
https://transition.fcc.gov/fcc-bin/amq?list=0&facid=54852
https://transition.fcc.gov/Bureaus/MB/Databases/AM_DA_patterns/445bc69f439c4205a14bc1b6063ebeb7-21377.pdf
Primary gain is to about 155 degrees magnetic.
Our location is aproximately 95 degrees magnetic, kind of side lobe but definiely gain.
From the plot, seeing 161mV/m E field at 1km from the antenna. (pretty strong!)
There is a mystery to solve here. I still need to untangle a few things, and I'm hoping that by monitoring multiple stations for multiple hours I can de-convolve the
- Effects due to my apparatus gain differences etc
- understand the variations as a function of time for the channel (through the atmosphere.)
- if you look at the FFT plot above it is obvious that my apparatus has a frequency response.
As I'm writing this, I would assume that due to proximity WLNA 1420 2km distant should be pure groundwave and WCBS 880 at 30+ km will have some skywave issues.
Enough for today. More as it comes in.
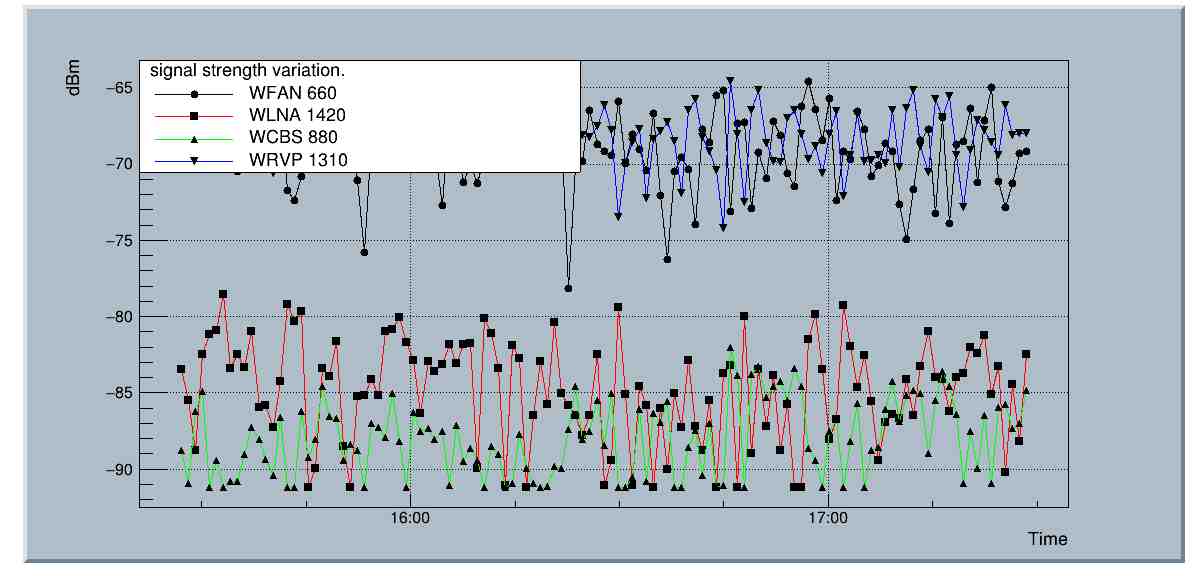
08-Jan-23 Ran a collection for about 2 hours last night, the results are disappointing.
This shows the time series (EST along the x axis and dBm for the peak in the FFT along the Y axis) WFAN and WRVP appear to both have large signals. I tried to get a correlation between the two. It ended up being 0.3, pretty bad.
I'm now doing an 8 hour run. See how that goes.


Comments
Post a Comment